Active listings
5
Active listings
5
Sales (30D)
7
Most recently removed listings from tracked inventory (presumed sold).
| Image | Title | Price | Year | Mileage | Listed | Sold |
|---|---|---|---|---|---|---|
| £1,995 | £1,995 | 2008 | 26,500 mi | 5 Jun 2026 | 15 Jun 2026 | |
| £2,895 | £2,895 | 2008 | 21,000 mi | 14 May 2026 | 14 Jun 2026 | |
| £3,295 | £3,295 | 2007 | 9,516 mi | 2 Mar 2026 | 13 Jun 2026 | |
| £3,089 | £3,089 | 2013 | 15,900 mi | 14 Apr 2026 | 12 Jun 2026 | |
| £2,594 | £2,594 | 2010 | 26,894 mi | 27 Apr 2026 | 7 Jun 2026 | |
| £2,695 | £2,695 | 2011 | 30,697 mi | 10 May 2026 | 6 Jun 2026 | |
| £1,895 | £1,895 | 2007 | 20,700 mi | 6 May 2026 | 1 Jun 2026 |
Active listings for this market, updated daily.

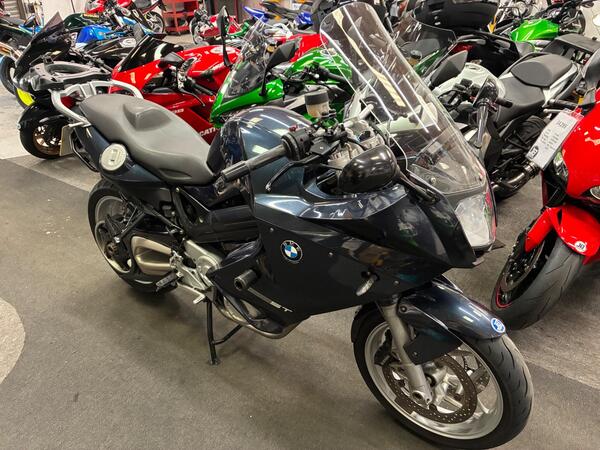 1 / 13
798cc
£2,495
Listed 14 May 2026
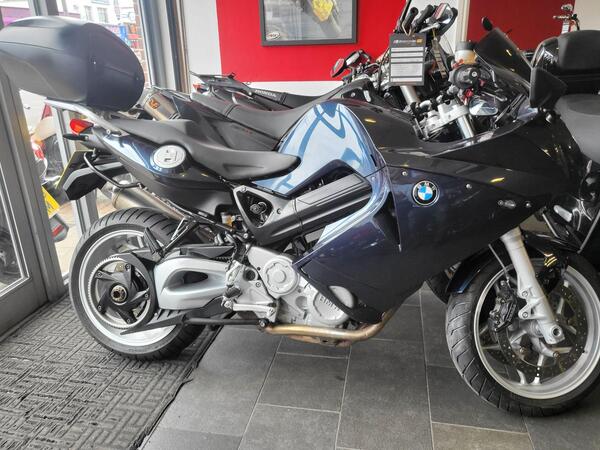 1 image
798cc
£2,995
Listed 30 Jul 2025
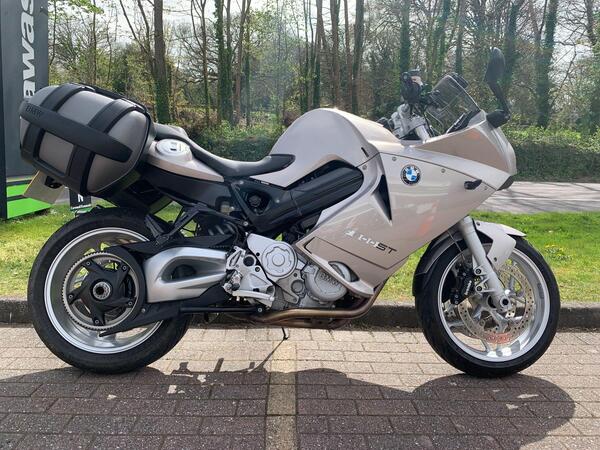 1 / 20
798cc
£3,995
Listed 12 Apr 2026
 1 / 18
798cc
£4,199
Listed 14 Apr 2026
 1 / 14
798cc
£4,590
Listed 30 Apr 2026
Exact listing count per day from observed inventory snapshots
Daily flow over the last 30 days (from 2026-05-26 onward)
Price distribution across listings.
5 data points — hidden by default to keep the page fast.
Price distribution across listings.
7 data points — hidden by default to keep the page fast.